In the last couple of months I’ve been learning about what information can I extract from a codebase. I’ve written some articles on how to use NDepend to extract a static view of the system’s quality. But this view is based only on the current state of the codebase. What about source code history? What can it tell us? How has the code changed? These are exactly the kind of questions that Adam Thornhill‘s book, Your Code as a Crime Scene: Use Forensic Techniques to Arrest Defects, Bottlenecks, and Bad Design in Your Programs, tries to answer.
Summary
The book contains three parts and it’s meant to be read from start to finish. In this section we’ll see a brief summary of each chapter.
Part I – Evolving Software
Code as a Crime Scene
The central idea of the book is that you can’t understand a complex system just by looking at a snapshot of the code. By harnessing the historical information of a project we can make more informed decisions. This information is readily available in the Version Control Systems that we use.
For large codebases it’s hard to identify what improvements would be the most valuable. To find what module should be our highest priority, we need to answer several questions: is this module complex?, is this module error prone?, will I work on this module in the future? Answering these questions is a hard job even for smaller teams. When you’re dealing with multiple teams, you cannot rely on a developers’ opinion, since intuition doesn’t scale. This book presents how to answer these questions by using automated techniques inspired by criminal psychology.
The author shows how geographical offender profiling can be applied to code. There are tools that help visualize software (e.g. CodeCity). But these tools usually work only for a limited set of programming languages. Exploring the geography of code should work on the polyglot solutions that we develop nowadays. VCS systems contain the required data and should be used when we explore the geography of code.
Creating an Offender Profile
This chapter shows how to detect hotspots by analyzing change frequency and complexity. The author uses Code Maat to extract file change frequency from git. This is an open source tool that the author created as a companion to the book. The number of lines of code is used as a proxy metric for complexity. Cloc is one tool that can compute this simple metric.
Analyze Hotspots in Large-Scale Systems
To help make sense of a system’s complexity we need better tools. Raw metric data is hard to understand. This is where visualization techniques shine. They help us make sense of large volumes of data. Chapter 4 presents a visualization technique called an enclosure diagram. Enclosure diagrams are based on the zoomable circle parking algorithm. Here is an enclosure diagram for a Hibernate package:
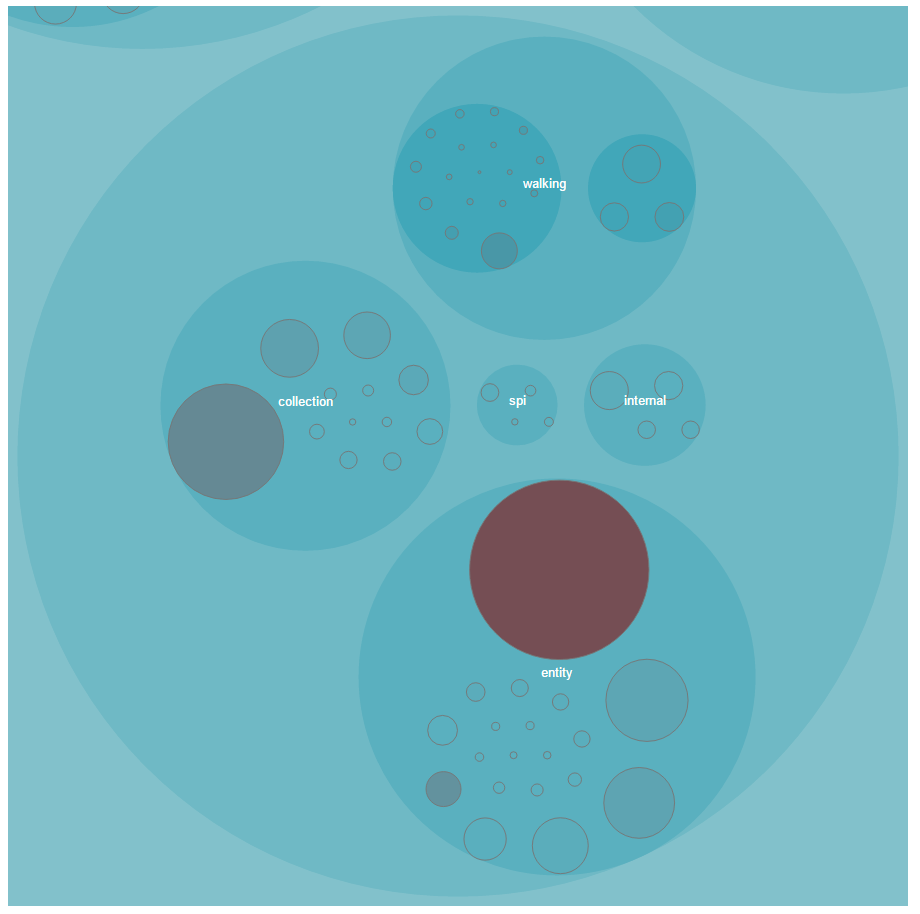
Each circle represents a part of the system. This visualization technique maps two metrics: effort on color and complexity on area.
To showcase how these are useful the author uses Hibernate as a case study. We get the raw data using Code Maat and cloc, transform it in the required format using a Python script, then visualize it using D3.js. This is how the image above was generated.
Judge Hotspots with the Power of Names
A tool cannot replace our own experience. After identifying the hotspots, we need to separate the real issue from the false positives. One quick way to do this is to just check the names. This can help us separate modules that contain complex logic from modules that contain only configurations for example.
Calculate Complexity Trends from Your Code’s Shape
Of course, the naming heuristic has its limitation, and sometimes we need to dig deeper. One approach of evaluating a hotspot is to use another simple metric as a proxy for complexity: indentation. We can use a simple spreadsheet application to plot the complexity trend over time and see if our code is deteriorating.
Part II – Dissect Your Architecture
Treat Your Code As a Cooperative Witness
In this chapter the author discusses how to analyze the architecture of a system. He introduces the notion of temporal coupling (or change coupling). Two modules are temporally coupled if they change together. This can happen for multiple reasons: copy-paste, inadequate encapsulation or modules that are in a producer-consumer relationship. Temporal coupling is a good indicator of defect prone modules.
Detect Architectural Decay
Chapter 8 shows how to detect temporal coupling in practice. The Sum of Coupling is a metric that looks at how many times a module has been coupled to another module in a commit. After finding out what are the hotspots, we can see what modules change together frequently. Code Maat has support for this type of analysis.
Since temporal coupling might vary over time, it’s good to split the analyzed periods and compare them (e.g. releases, sprints, etc.). This can help you get more focused results. You can even use story boards to track the evolution of temporal coupling over time.
Build a Safety Net for Your Architecture
In this chapter the author presents how to detect when automated tests get too coupled to production code. If the previous chapters focused on detecting coupled modules, this chapter centers around detecting temporal coupling at a system level. This is done by identifying different components in your code (e.g. code and test) through file paths or regular expressions and detecting coupling between these components.
Use Beauty as a Guiding Principle
Chapter 10 applies the same principles to architectural boundaries. We can identify the main components of our application by looking at the architectural boundaries. Then we can analyze the coupling between these components and identify expensive change patterns across architectural boundaries. One example would be two microservices that change together.
Part III – Master the Social Aspects of Code
Norms, Groups, and False Serial Killers
Chapter 11 sets the stage for the last part of the book, which centers around the social aspects of coding. It introduces process loss and social biases. According to the process loss theory, groups cannot be 100% efficient. With bigger teams comes a bigger coordination cost. Some of the social biases mentioned are pluralistic ignorance and inferring the popularity of an opinion based on its familiarity.
Commit messages can tell you something new about your team. By generating a word cloud from your commit message log, you can see the dominating terms. You would expect that the most common words to be domain concepts. But what if most of the concepts revolve around bugs, fixes, and tests?
Discover Organizational Metrics in Your Codebase
This chapter delves into how to extract organization metrics from the code. We can calculate author frequencies to discover which modules are shared among many developers. These are likely to contain defects. We can also evaluate the communication cost. If two tightly coupled modules have different main developers, we need to ensure that they can communicate easily.
Build a Knowledge Map of Your System
Different author patterns influence your system. Fractal figures is a visualization technique that can help us see the effort distribution per developer. Each rectangle is a module. Each author of the module has a different color and the area of its rectangle is proportional to the author’s commits. A large number of minor contributors can indicate error prone code.

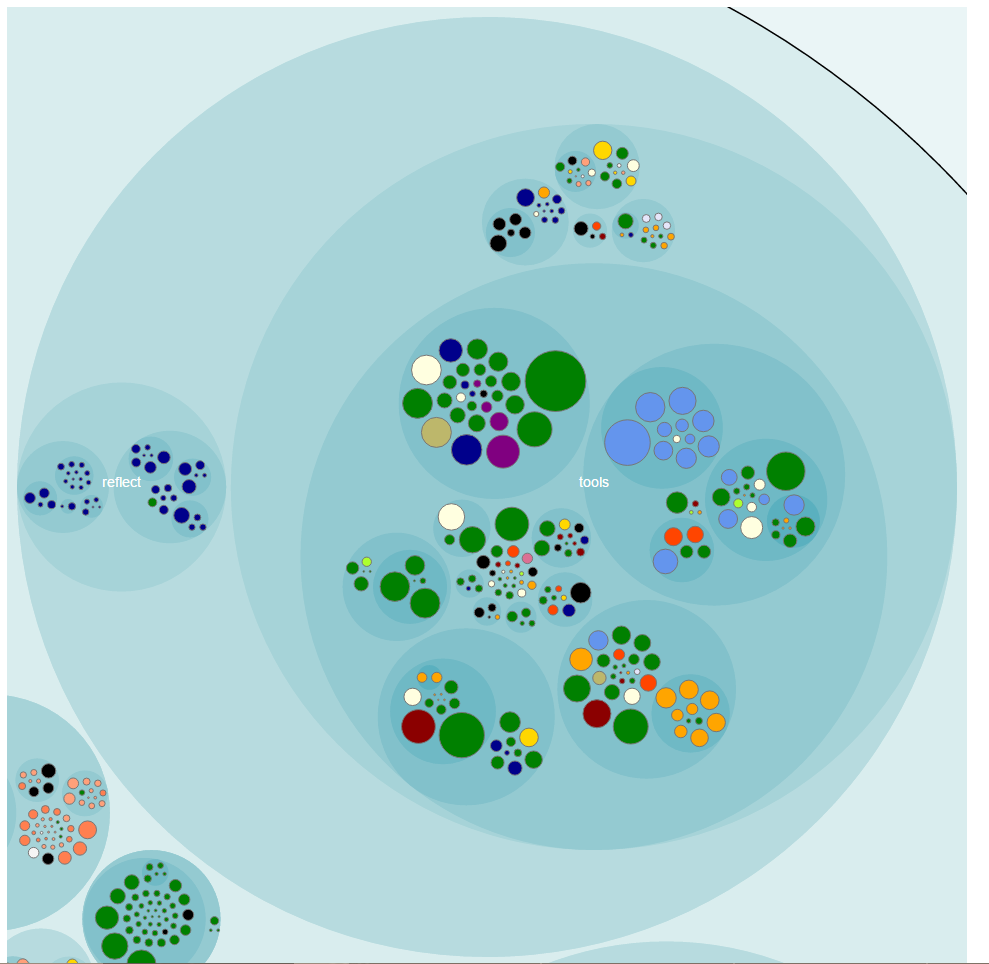
A knowledge map outlines the knowledge distribution. Visualizing a knowledge map for developers that are no longer on the team can help us spot knowledge loss. Below you can see an example of a knowledge map. Each circle represents a module. Its size maps to complexity and its color indicates the main developer:
Dive Deeper with Code Churn
In this chapter the author discusses how code churn can help us detect process loss. Also, by linking temporal coupling with code churn, we can get an idea of the change patterns of our code. This can help us prioritize which modules need refactoring first.
Toward the Future
The last chapter of the book is a great summary, showing how to use the presented analysis techniques together to get the most out of them. It also discusses future improvements that are not supported by today’s tooling.
Biggest Takeaways
Sometimes simple metrics are good enough
This book relies on simple, yet surprisingly effective metrics. As an example, lines of code is used as a proxy metric for complexity. This metric is by no means perfect, but, on my project, it did flag most of the same classes as McCabe’s cyclomatic number. There is definitely a correlation between the size of a file and its complexity. This simplicity comes with a great advantage: it’s language agnostic, so you can use it on a polyglot codebase. Yet another example is using indentation as a metric for complexity.
Version Control Systems are a gold mine
I expected most of the hotspots that Code Maat detected on the codebase that I’m currently working on. But this is code that I’ve been working with for a while and I know pretty well. Running this kind of analysis on a new project can definitely help you ramp up and be productive in a shorter period of time. Also, it can help a team base its decision on facts and data, not only on intuition.
Although powerful, Code Maat is a simple program. As more people are interested in code archaeology, I’m sure that future tools will support even more interesting analysis techniques. These techniques will help us dig even more in our project’s history. Couple that with the static view of the code and bug tracker information and you’ll have a lot more data to base your decisions on.
Temporal Coupling
I think the name temporal coupling is ambiguous, since this is already a well-known type of coupling. I prefer its synonym: change coupling. This being said, this metric is a good indicator of design issues. I’ve blogged about how to detect the shotgun surgery code smell using NDepend. But that detection strategy relied on the static view of the code. Looking at the commit history and detecting change coupling is probably a better detection strategy for this code smell.
I like the grouping feature of Code Maat. This enables us to detect temporal coupling not only at a file level, but at an architectural level too. If two architecturally significant components (e.g. two layers or two microservices) that should be decoupled are frequently changed together, you would want to know as soon as possible, in order to fix this design issue.
The social aspects of code
Seeing a knowledge map of your system is insightful. One such map can tell you if some of the team members are becoming polls of knowledge, or if too many people are working on the same piece of code.
Another useful application of a knowledge distribution map is to anticipate knowledge loss. Visualizing the knowledge loss when a team member decides to leave the team can help you organize future knowledge transfer sessions. Seeing how team members collaborate can also provide insights onto how to better organize the team (think of Conway’s Law).
Improvements
The book is fairly short and the author emphasizes that the focus is on the techniques, not on the tools. This being said, Code Maat is used a lot in order to parse VCS logs and extract the required information. I think that a more thorough description of the different techniques and how to implement them would have enabled readers to better understand them. Also, I would have liked to see even more practical examples of how these techniques can help improve larger codebases.
Conclusion
Most of us use version control systems only as repositories for code. But they can be much more than that since they contain a lot of useful information about a project’s history. Your Code as a Crime Scene describes how to mine them for new insights into our code and environment. It presents some novel techniques useful for detecting hot spots and error prone code. The book is accompanied by a tool, Code Maat, that you can use to apply the techniques on your own projects. Although the tool is a black box, having the ability to put theory into practice is a big win. The book takes a look at the source code of Code Maat, but also at more mature and larger projects like Craft.Net, Hibernate and Scala.
Most of the techniques rely on simple metrics. I was surprised by how powerful they can be. This simplicity has its strengths and weaknesses. On one hand, they are language agnostic, so they can be applied on any codebase, regardless of language. On the other hand, simplicity means they are less precise than other more complete metrics. But the author cites studies that prove these simple metrics are as good at detecting error prone code as other, more complex metrics.
The author also draws from his personal experience and describes how these techniques helped him (or would have helped him) in the past. I always find this useful and I think it helps emphasize the effectiveness of these techniques.
At under 200 pages, this book is packed with information. I recommend reading it and then employing the analysis techniques on your own projects. This data can help you get a better knowledge of a project and make better decisions.
Thanks for the review – interesting to get your perspective on the book. The analyses have evolved since I wrote the book. I do have more examples on how the techniques help improve large codebases. For example this case study on Analyzing Patterns in the Evolution of Linux: http://www.empear.com/blog/software-revolution-part4/
Thanks for sharing the link! Really interesting to see how you approached analyzing a code base of that scale. I’ve just finished reading the Software (r)Evolution article series and they are a great addition to the book!